Open High Low Close Volume
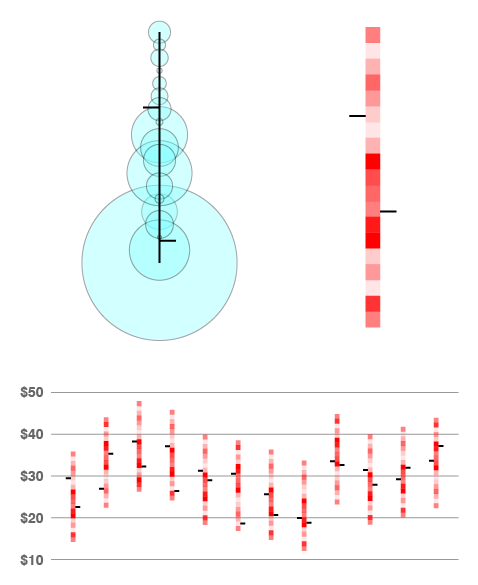
These charts takes a typical OHLC one step further by including the volume of trades at each price point. The chart on the left displays volume with circles while the one on the right displays volume like a heat map. The bottom graphic shows daily data.